Address
243 Scalehouse Loop Suite 5B,
Bend, OR 97702
Get in touch
(541) 678-5475
Follow us
History of U.S. Bear & Bull Markets Since 1926
History of U.S. Bear & Bull Markets Since 1926
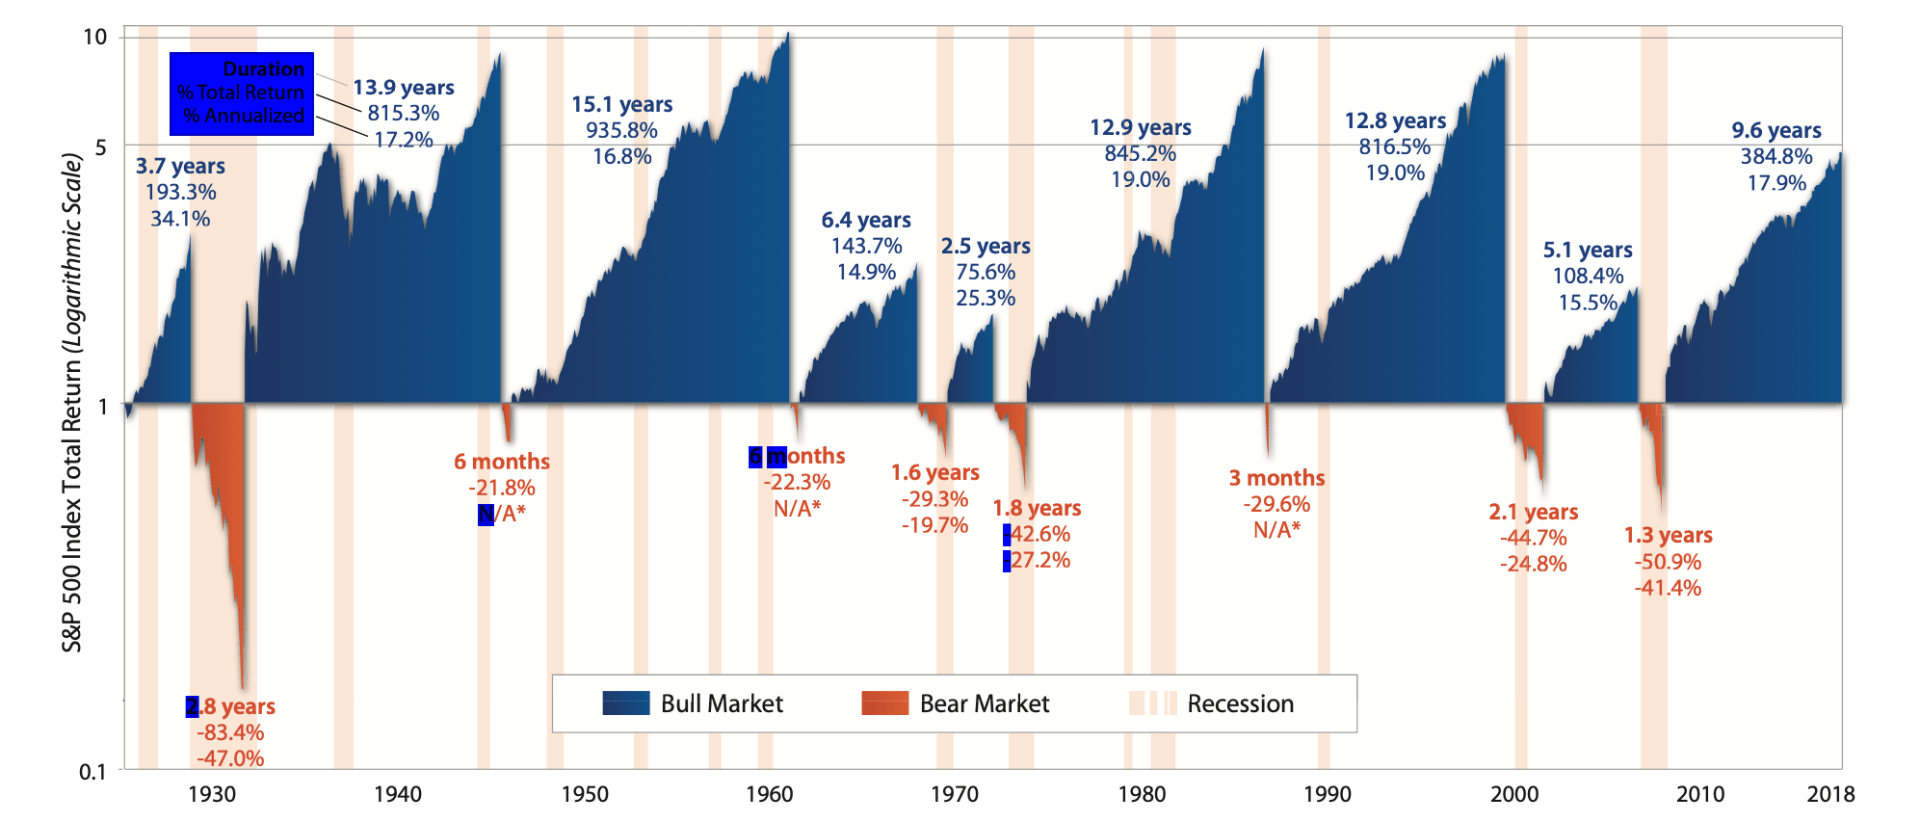
This chart shows historical performance of the S&P 500 Index throughout the U.S. Bull and Bear Markets from 1926 through September 2018. Although past performance is no guarantee of future results, we believe looking at the history of the market’s expansions and recessions helps to gain a fresh perspective on the benefits of investing for the long-term.
• The average Bull Market period lasted 9.1 years with an average cumulative total return of 480%.
• The average Bear Market period lasted 1.4 years with an average cumulative loss of -41%.
Source: First Trust Advisors L.P., Morningstar. Returns from 1926 - 9/28/18. *Not applicable since duration is less than one year.
These results are based on monthly returns–returns using different periods would produce different results. The S&P 500 Index is an unmanaged index of 500 stocks used to measure large-cap U.S. stock market performance. Investors cannot invest directly in an index. Index returns do not reflect any fees, expenses, or sales charges. This chart is for illustrative purposes only and not indicative of any actual investment. These returns were the result of certain market factors and events which may not be repeated in the future. Past performance is no guarantee of future results.
The information presented is not intended to constitute an investment recommendation for, or advice to, any specific person. By providing this information, First Trust is not undertaking to give advice in any fiduciary capacity within the meaning of ERISA and the Internal Revenue Code. First Trust has no knowledge of and has not been provided any information regarding any investor. Financial advisors must determine whether particular investments are appropriate for their clients. First Trust believes the financial advisor is a fiduciary, is capable of evaluating investment risks independently and is responsible for exercising independent judgment with respect to its retirement plan clients.
From the lowest close reached after the market has fallen 20% or more, to the next market high.
From when the index closes at least 20% down from its previous high close, through the lowest close reached after it has fallen 20% or more.
LINKS:

HOURS
- Mon - Fri
- -
- Sat - Sun
- Closed
ADDRESS
243 SW Scalehouse Loop, Suite 1A,
Bend, OR 97702
PHONE
A Registered Investment Advisor
Investment Advice is offered through Cascade Financial Strategies, a registered investment advisor licensed in Bend, Oregon, California and Idaho (We also operate in other states under the "de minimis" exemption, meaning having five or fewer clients within that state).
An investment advisor or IA rep may only transact business in a particular state after licensure or satisfying qualifications requirements of that state, or only if they are excluded or exempted from the state’s investment advisor or IA rep requirements; and follow up, individualized responses to consumers in a particular state by investment advisor or IA rep that involve either the effecting or attempting to effect transactions in securities or the rendering of personalized investment advice for compensation, shall not be made without first complying with the state’s investment advisor or IA rep requirements, or pursuant to an applicable state exemption or exclusion. For information concerning the licensure status or disciplinary history of an investment advisor or IA rep, please do not hesitate to contact your state securities law administrator. Cascade Financial Strategies